Quarterly : 2025 |
3M | 6M | 9M | 2025 |
|---|---|---|---|---|
| Profit & Loss (Million Baht) | ||||
| Services Revenue | 874 | 1,760 | 1,760 | |
| Total Services Revenue | 882 | 1,824 | 1,824 | |
| Cost of Services | 752 | 1,570 | 1,570 | |
| EBITDA | 271 | 480 | 480 | |
| EBIT | 80 | 97 | 97 | |
| Net Profit | 8 | (45) | (45) | |
| Financial Position (Million Baht) | ||||
| Total Assets | 8,646 | 8,363 | 8,363 | |
| Current Assets | 1,371 | 1,208 | 1,208 | |
| Non-Current Assets | 7,275 | 7,155 | 7,155 | |
| Total Liabilities | 5,873 | 5,643 | 5,643 | |
| Current Liabilities | 3,678 | 3,071 | 3,071 | |
| Non-Current Liabilities | 2,195 | 2,572 | 2,572 | |
| Shareholders’ Equity | 2,773 | 2,720 | 2,720 | |
| Financial Ratios | ||||
| Asset Performance | ||||
| Asset Turnover (times) | 0.46 | 0.45 | 0.45 | |
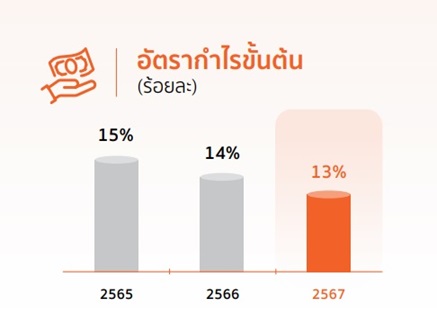
| Gross Profit Margin (%) | 13.91% | 10.83% | 10.83% | |
| EBITDA Margin (%) | 30.70% | 26.32% | 26.32% | |
| EBIT Margin (%) | 8.87% | 5.32% | 5.32% | |
| Net Profit Margin (%) | 0.83% | (2.48%) | (2.48%) | |
| Return on Equity (%) | 8.30% | 7.02% | 7.02% | |
| Return on Assets (%) | 2.64% | 2.27% | 2.27% | |
| Stock Data | ||||
| Earning per share (Baht/share) | 0.01 | (0.04) | (0.04) | |
| Authorized Capital (M baht) | 1,149 | 1,149 | 1,149 | |
| Paid-up Capital (M baht) | 1,149 | 1,149 | 1,149 |
Financial Details
Yearly |
2020 | 2021 | 2022 | 2023 | 2024 |
|---|---|---|---|---|---|
| Profit & Loss (Million Baht) | |||||
| Services Revenue | 4,726 | 4,712 | 5,158 | 6,095 | 4,385 |
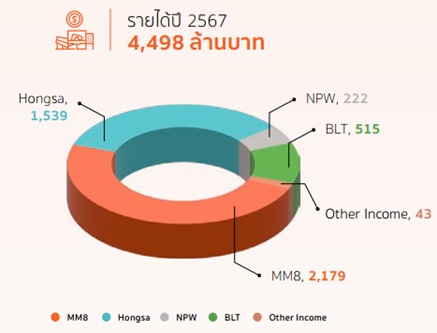
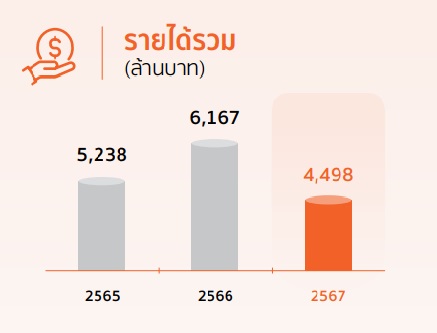
| Total Services Revenue | 4,776 | 4,803 | 5,238 | 6,167 | 4,498 |
| Cost of Services | 3,740 | 3,769 | 4,390 | 5,227 | 3,802 |
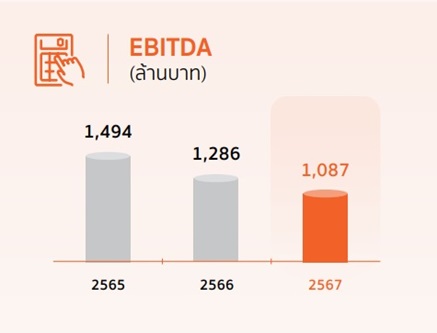
| EBITDA | 1,647 | 1,604 | 1,494 | 1,286 | 1,087 |
| EBIT | 544 | 594 | 553 | 434 | 275 |
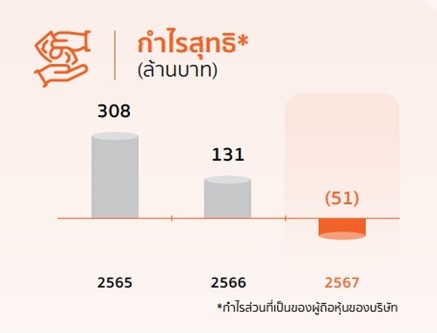
| Net Profit | 241 | 351 | 308 | 131 | 51 |
| Financial Position (Million Baht) | |||||
| Total Assets | 10,017 | 9,210 | 8,870 | 9,556 | 8,795 |
| Current Assets | 1,739 | 1,541 | 1,603 | 1,688 | 1,388 |
| Non-Current Assets | 8,278 | 7,669 | 7,267 | 7,868 | 7,407 |
| Total Liabilities | 7,604 | 6,552 | 5,995 | 6,677 | 6,030 |
| Current Liabilities | 2,927 | 3,279 | 3,064 | 4,470 | 3,662 |
| Non-Current Liabilities | 4,677 | 3,273 | 2,932 | 2,207 | 2,368 |
| Shareholders’ Equity | 2,412 | 2,658 | 2,874 | 2,879 | 2,765 |
| Financial Ratios | |||||
| Asset Performance | |||||
| Asset Turnover (times) | 0.45 | 0.50 | 0.58 | 0.67 | 0.49 |
| Gross Profit Margin (%) | 20.86% | 20.03% | 14.89% | 14.24% | 13.29% |
| EBITDA Margin (%) | 34.85% | 34.04% | 28.96% | 21.10% | 24.79% |
| EBIT Margin (%) | 11.52% | 12.61% | 10.72% | 7.12% | 6.10% |
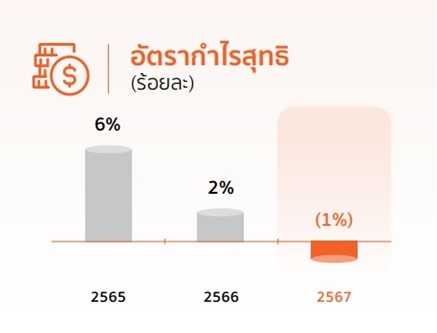
| Net Profit Margin (%) | 5.05% | 7.30% | 5.88% | 2.12% | 1.13% |
| Return on Equity (%) | 10.53% | 13.83% | 11.06% | 4.51% | 9.73% |
| Return on Assets (%) | 2.28% | 3.65% | 3.41% | 1.42% | 2.99% |
| Stock Data | |||||
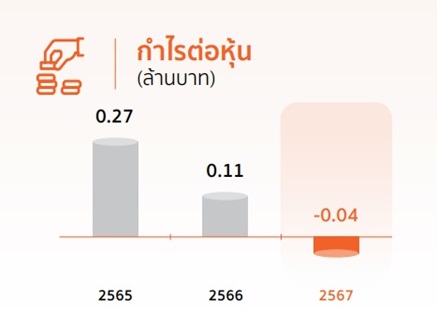
| Earning per share (Baht/share) | 0.21 | 0.31 | 0.27 | 0.11 | 0.04 |
| Authorized Capital (M baht) | 1,150 | 1,150 | 1,149 | 1,149 | 1,149 |
| Paid-up Capital (M baht) | 1,141 | 1,149 | 1,149 | 1,149 | 1,149 |
Yearly |
2015 | 2016 | 2017 | 2018 | 2019 |
|---|---|---|---|---|---|
| Profit & Loss (Million Baht) | |||||
| Services Revenue | 1,868 | 2,891 | 3,154 | 3,567 | 4,690 |
| Total Services Revenue | 1,873 | 2,911 | 3,186 | 3,624 | 4,773 |
| Cost of Services | 1,378 | 2,063 | 2,322 | 3,445 | 4,040 |
| EBITDA | 683 | 1,169 | 1,183 | 904 | 1,562 |
| EBIT | 211 | 558 | 572 | (132) | (384) |
| Net Profit | 89 | 323 | 360 | (285) | (1) |
| Financial Position (Million Baht) | |||||
| Total Assets | 4,489 | 6,004 | 10,241 | 11,987 | 11,106 |
| Current Assets | 919 | 2,255 | 1,990 | 2,304 | 2,065 |
| Non-Current Assets | 3,570 | 3,749 | 8,251 | 9,683 | 9,041 |
| Total Liabilities | 3,749 | 3,753 | 7,663 | 9,821 | 8,941 |
| Current Liabilities | 1,690 | 1,960 | 3,807 | 4,215 | 3,555 |
| Non-Current Liabilities | 2,059 | 1,794 | 3,855 | 5,606 | 5,386 |
| Shareholders’ Equity | 740 | 2,251 | 2,578 | 2,166 | 2,166 |
| Financial Ratios | |||||
| Asset Performance | |||||
| Asset Turnover (times) | 0.52 | 0.55 | 0.39 | 0.33 | 0.41 |
| Gross Profit Margin (%) | 26.23% | 28.64% | 26.38% | 3.41% | 13.86% |
| EBITDA Margin (%) | 36.58% | 40.44% | 37.50% | 25.33% | 33.32% |
| EBIT Margin (%) | 11.31% | 19.29% | 18.14% | (3.71%) | (8.19%) |
| Net Profit Margin (%) | 4.74% | 11.08% | 11.30% | (7.85%) | (0.02%) |
| Return on Equity (%) | 15.73% | 21.58% | 14.91% | (12.00%) | (0.05%) |
| Return on Assets (%) | 2.45% | 6.15% | 4.43% | (2.56%) | (0.01%) |
| Stock Data | |||||
| Earning per share (Baht/share) | 0.12 | 0.39 | 0.32 | (0.25) | (0.00) |
| Authorized Capital (M baht) | 1,000 | 1,500 | 1,500 | 1,500 | 1,150 |
| Paid-up Capital (M baht) | 750 | 1,130 | 1,130 | 1,130 | 1,139 |